Integrated Automation and Control Solution
Our smart factory platform offers a range of packaged solutions for optimized factory automation,
ensuring a smooth and reliable experience from installation to operation.
By harnessing data from individual equipment and inter-equipment processes, our integrated solution streamlines
production management, equipment maintenance, and real-time monitoring. With instant processing capabilities,
it helps customers make better use of their resources and achieve maximum operational efficiency.
production management, equipment maintenance, and real-time monitoring. With instant processing capabilities,
it helps customers make better use of their resources and achieve maximum operational efficiency.
MES
EAS
MCS
WMS
FMB
QMS
RMS
PMS
DSP
rSPC
Field-oriented
Optimized service


What does it do?
nexbe+ rSPC is an On/Off-line Real-Time Statistical Process Control (rSPC) system that collects production and measurement data in real time. By utilizing statistical data and analytical methods, it identifies anomalies early and provides warnings to prevent potential issues.
With nexbe+ rSPC, You Can
“Real-Time Statistical Process Control”
Reference data management
- Control Rule, Control Chart, rSPC Spec modeling
Real-time rule check
- Calculates statistical data and control
- parameters for each control target; runs rule violation checks and stores the results.
- OCAP interface (Interfaces with MES services to perform corrective actions)
Analysis
-
Cp/Cpk Report, Simulation
(Spec and Control Limit estimate), Index Report(Alarm, Cp/Cpk)
Manages statistical values through batch management
- CL (Automatically generate CLs based on raw data)
Product Configuration
- rSPC collects user-defined data, performs rule checks, and stores the results.
- When a Rule Out occurs, the system interfaces with MES or handles other events according to guidelines defined by the OCAP (Out of Control Action Plan).
Field-oriented
Optimized service
01Modeling - Define Control Item

02Modeling – Virtual Item

03Control Chart – Chart Spec


04Control Chart – Chart Point Hide & Ignore

05Handle Control Data – Edit, Delete Control Data

06Provides industry-common default rules and custom rules
Basic Western Electric Rule provided by default
- Zone rules for symmetric data (4 types)
- R-chart rules for asymmetric data (7 types)
- Trend rules (2 types)
Nelson Rule provided by default
- 8 types of symmetric & asymmetric rules
Supports custom rule definitions
- Limit out type
- Bias type
- Trend type
- Oscillation type
- Allows user customization of management limits by type, with runtime application.

07Rules – Western Electric Rule
Cate | No. | Description | Applicable chart |
---|---|---|---|
Zone Rule | R1 | 
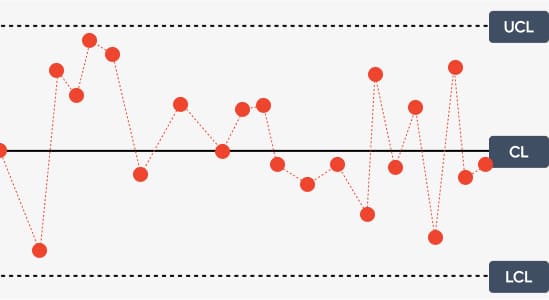
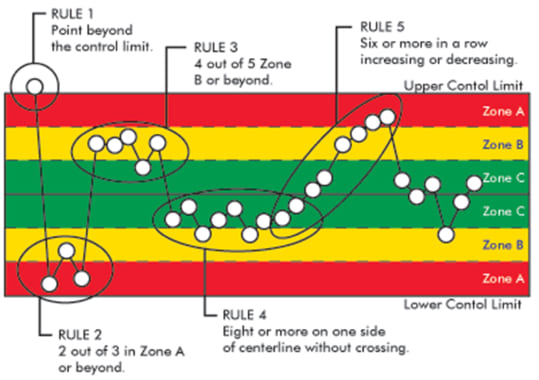
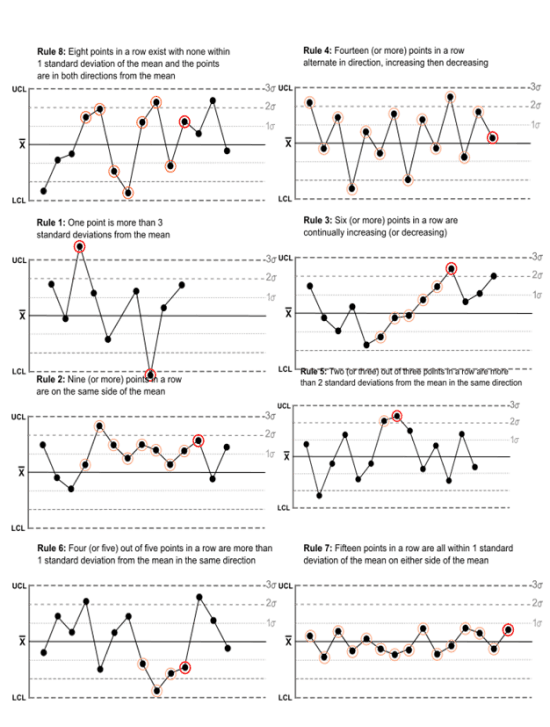
Any single data point falls outside the 3σ limit from the centerline (i.e., any point that falls outside Zone A, beyond either the upper or lower control limit) | – Apply symmetric data (X-bar chart) |
R2 | Two out of three consecutive points fall beyond the 2σ limit (in zone A or beyond), on the same side of the centerline | ||
R3 | Four out of five consecutive points fall beyond the 1σ limit (in zone B or beyond), on the same side of the centerline | ||
R4 | Eight consecutive points fall on the same side of the centerline (in zone C or beyond) | ||
R-Chart Rule | R5 | Any single data point falling above the +3σ limit | – Small sub-group sample (<5) – Apply asymmetric data (R-chart, p-chart,..) |
R6 | Two consecutive points falling above the +2σ limit (in the upper zone A or above) | ||
R7 | Three consecutive points falling above the +1σ limit (in the upper zone B or above) | ||
R8 | Seven consecutive points falling above the centerline (in the upper zone C or above) | ||
R9 | Ten consecutive points falling below the centerline (in the lower zone C or below) | ||
R10 | Six consecutive points falling below the -1σ limit (in the lower zone B or below) | ||
R11 | Four consecutive points falling below the -2σ limit (in the lower zone A) | ||
Trend | R12 | 6 in a row trending up or down | – |
R13 | 14 in a row alternating up and down |
08Rules – Nelson Rule
No. | Description | Applicable chart | |
---|---|---|---|
Rules | R1 | One point is more than 3 standard deviations from the mean. | X-bar, R-chart |
R2 | Nine (or more) points in a row are on the same side of the mean | ||
R3 | Six (or more) points in a row are continually increasing (or decreasing). | ||
R4 | Fourteen (or more) points in a row alternate in direction, increasing then decreasing. | ||
R5 | Two (or three) out of three points in a row are more than 2 standard deviations from the mean in the same direction. | Apply an X-bar chart | |
R6 | Four (or five) out of five points in a row are more than 1 standard deviation from the mean in the same direction. | ||
R7 | Fifteen points in a row are all within 1 standard deviation of the mean on either side of the mean. | ||
R8 | Eight points in a row exist with none within 1 standard deviation of the mean and the points are in both directions from the mean. |

09Provides 7 types of default control charts based on data attributes
Category | Attribute | Defect type | Chart type | Sample Size |
---|---|---|---|---|
Variable (Quality) | Measurable (thickness, temp., pressure,..) | X, mR Chart (Individuals and moving range) | Sample = 1 per sub group (point)
| |
Xbar, R Chart (Average and range) | Sample 2-10 per sub group (point) | |||
Xbar, S Chart (Average and STdev) | Sample > 10 per sub group (point) | |||
Attribute (Defects) | Countable (defect, defective product, ..) | Defective Unit | np Chart (number defective) | Sample size constants (defects per 100 CST) |
p Chart (proportion defective) | Sample size varies (defects per CST) | |||
Defects | c Chart (defects per subgroup) | Sample size constants (defect points per 100 samples) | ||
u Chart (defects per unit) | Sample size varies (defect points over a specific period) |
10Supports viewing and simulating Cp/Cpk reports for past and recent data.
Query conditions
- User-defined query conditions
- Supports up to 6 query conditions for filtering data by specific time periods.
Cp/Cpk Report
- Provides process capability index statistics for any user-defined period (daily, weekly, or monthly).
- Delivers statistical data for multiple items, not limited to single data points.
- Provides Cp, Cpk, Pp, Ppk, CA, CPM, Cnpk metrics
Simulation
- Provides simulation functionality for applying various control charts, control limits, and rules to the collected data.
- Estimates values for Spec Limit and Control Limit.
Excel out/print
- Saves raw data, stat. data into Excel file
- Chart print


11Generates period-specific Cp/Cpk reports and alarm reports by grouping rSPC data
Cp/Cpk Index Report
- Groups user-defined conditions to generate daily, weekly, and monthly process capability index reports.

Alarm Index Report
- Groups user-defined conditions to generate daily, weekly, and monthly reports on alarm occurrence rates.

Product Support
“Verified or Sustainable”
More than 30 years of experience and over 100 factories
UMS
- Providing comprehensive software maintenance through the UMS Center, addressing defect fixes, performance enhancements, feature improvements, and product updates after deployment
Operational Training
- System administrator manual provided for smooth post-deployment operations
- Product training for administrators
- Dedicated Product Management Center to oversee operating systems and handle routine maintenance
Product Support
- Product updates
- Online manuals and user guides
- Online platform for sharing feedback and suggestions related to the product