BoostBe+ is an advanced factory solution that produces products tailored to customer needs. It integrates IoT, AI, and big data to enable automation and digitization, going beyond traditional factory automation.
BoostBe+ features objects related to manufacturing, such as procurement, logistics, and consumers. These objects are equipped with intelligence and linked via IoT to power seamless data connection, collection, and analysis for autonomous operations.
YMS
rSPC
FDC/EPT
RPT
Field-oriented Optimized service
What does it do?
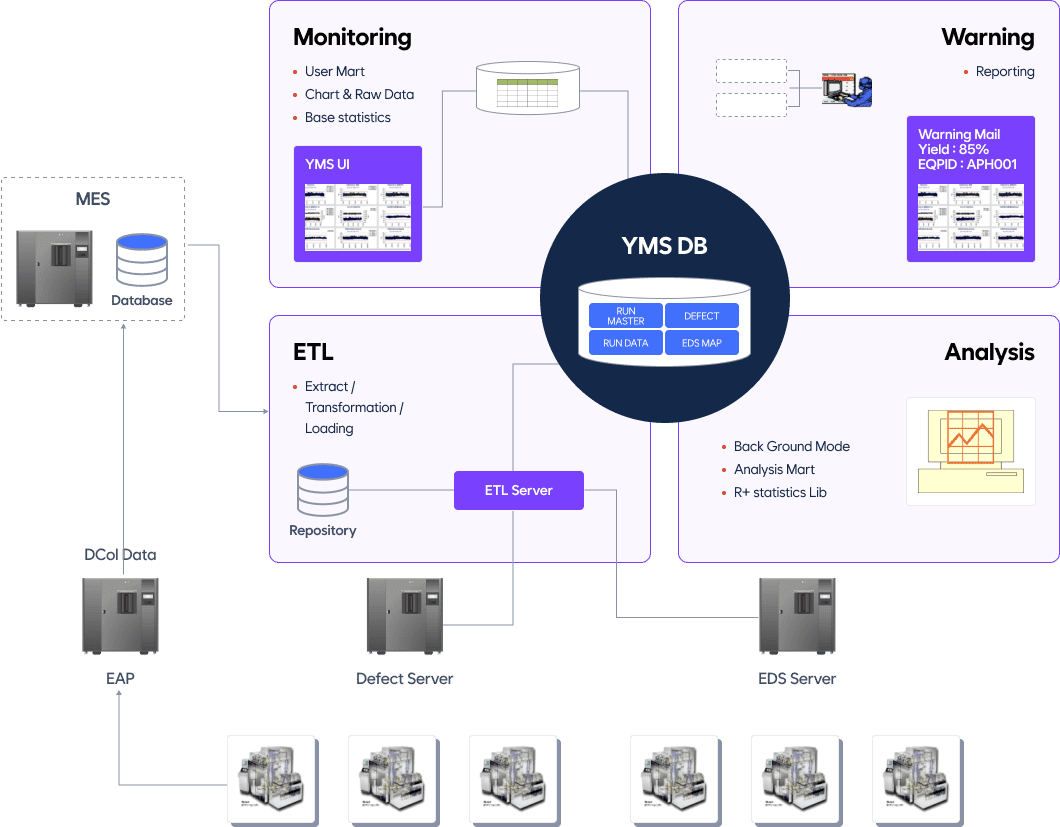
Yield Management System (YMS) leverages all data generated from the manufacturing process to identify potential root causes of issues, such as equipment or process inefficiencies, through structured and unstructured analysis.
1.
Data analysis: Analyzes data collected during production to detect anomalies and apply statistical methods to improve quality.
2.
Real-time monitoring: Monitors changes in process workflows in real-time, offering early warnings to address problems swiftly.
3.
Process improvement: Identifies optimal operating conditions by analyzing correlations between operational parameters and equipment, enhancing process efficiency.
4.
Data integration: Consolidates data from various sources to provide a comprehensive view of the environment.
Detects anomalies and analyzes statistical data to improve the quality of manufacturing processes. Features early warning tools that monitor abnormal signs in real-time process flows. Provides analytical functions that incorporate variability control and predictive process characteristics.
Product Configuration
Field-oriented Optimized service
Detects anomalies and analyzes statistical data to improve the quality of manufacturing processes. Features early warning tools that monitor abnormal signs in real-time process flows. Provides analytical functions that incorporate variability control and predictive process characteristics.
User-friendly
Open user interface
Field-oriented system that incorporates engineers' expertise
Data integration
Comprehensive data integration system for manufacturing processes
Optimized data network
Standardized analysis process
Consistent analysis quality without reliance on individual experience
Eliminates simple and repetitive tasks
Analytical capabilities enhanced using statistical techniques
Knowledge-based workflows
Workflows that incorporate engineers' expertise
01
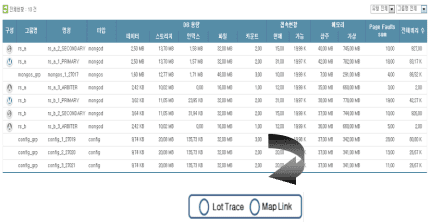
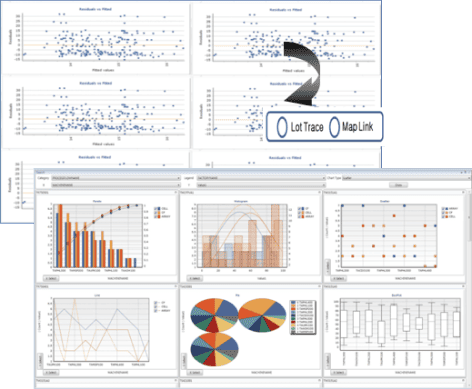
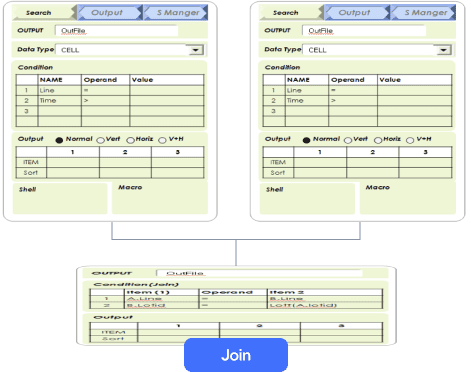
Search / Output/ Chart / Batch Chart (Line / Data /Pie / Bar / Histogram / Pareto / Box / Correlation Matrix ) Lot Link ( Trace , Defect Map ,EDS Map)
Output
Raw Data Display
: Line, Eqpid, Time, Item , Subitem, value
Excel save
Lot Trace / Wafer Map link
Field / Raw / Column modify
Chart
02
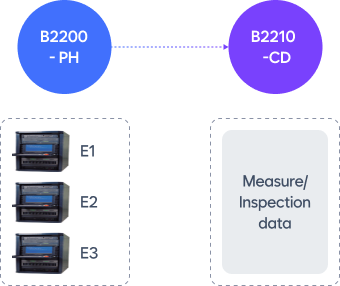
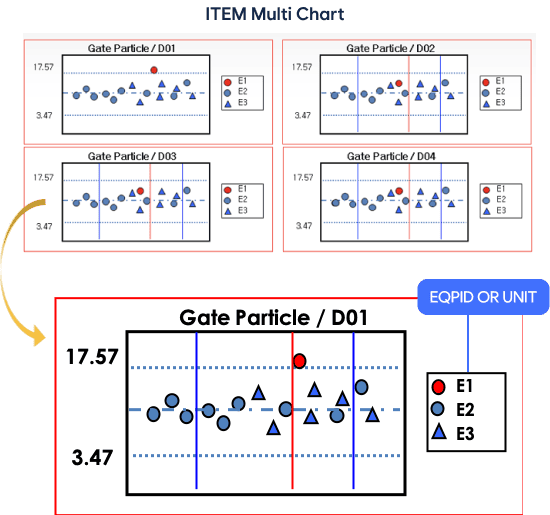
FAB Operation Monitoring Step1 Measure Operation , Step 2 Main Operation
M-P Operation
Inspection Step
Item
Value
Gate Particle
CD01
12
CD02
10
Gate-DEV AOI
Item1
10
Item2
20
Gate-DEV MAR
Item2
20
Chart
03
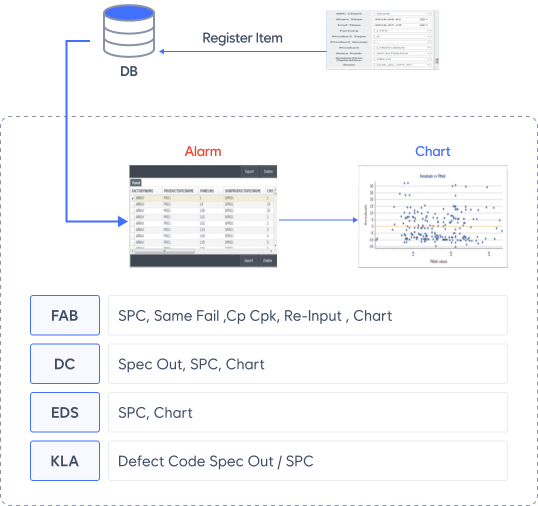
Real Time Warning : Error detection (FAB measurement, DC , EDS data) Daily Summary : Summary of the results of the previous generation
Real Time Warning
Daily Summary
Summary of product generated results
Detail alarm data
Item , Step chart
04
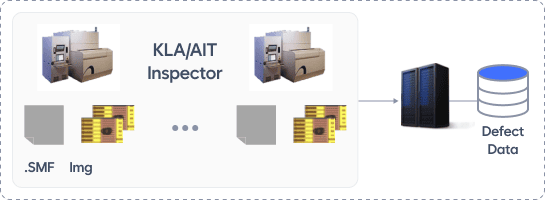
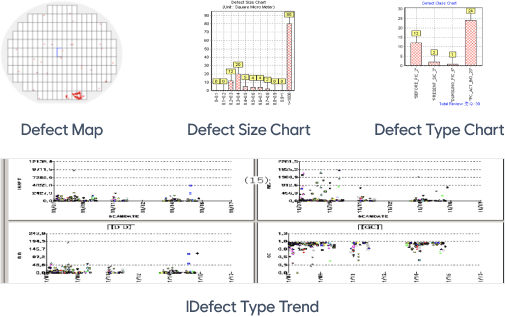
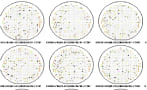
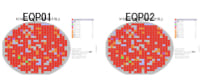
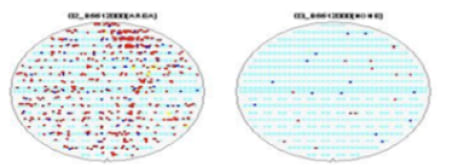
Defect Monitoring ( defect size , defect type Chart / total defect Trend), Map , Image DSA (Defect Source Analysis)
Monitoring
MAP & Image
MAP & Image
EQP Contact
05
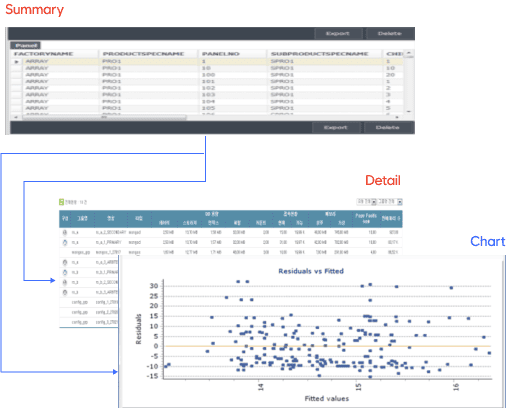
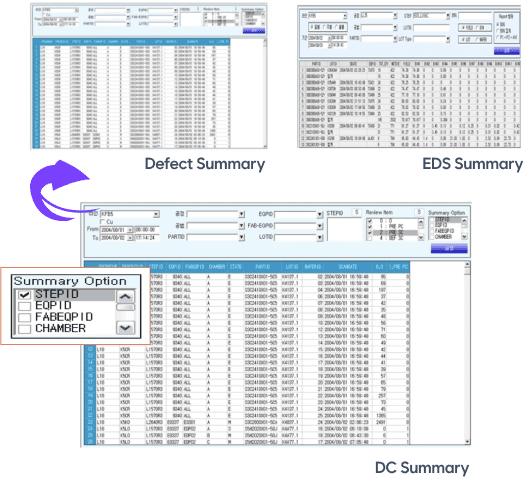
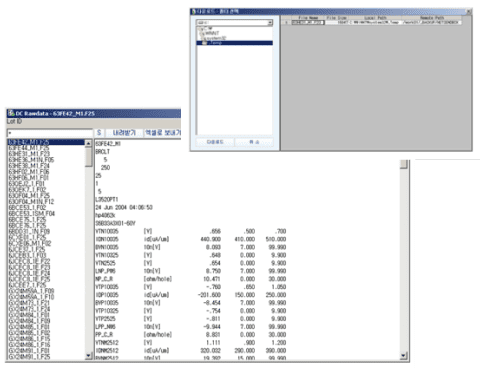
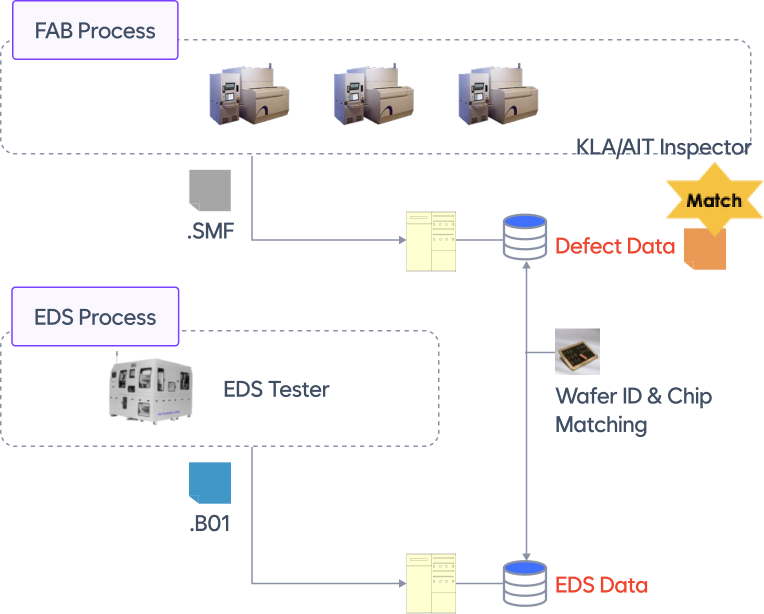
Data Summary : Error detection (FAB measurement, DC , EDS data) Raw data File : Summary of the results of the previous generation
Data Summary
Raw data file
DC /EDS Raw data file
Search : LOTID Like
Output view & download
06
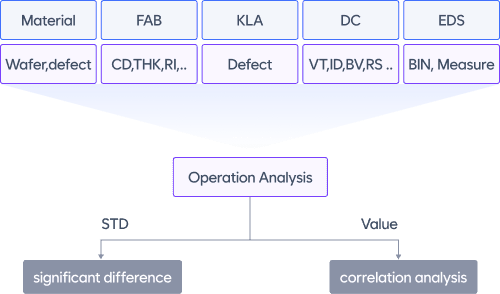
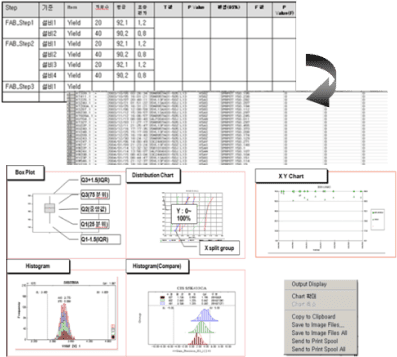
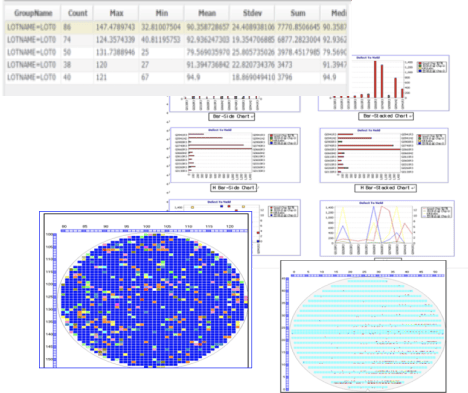
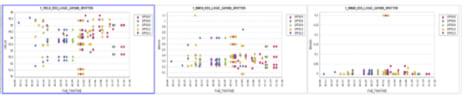
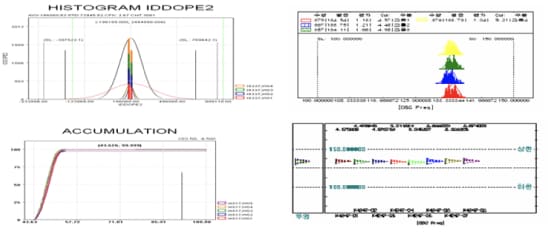
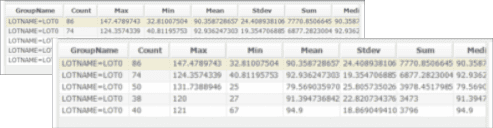
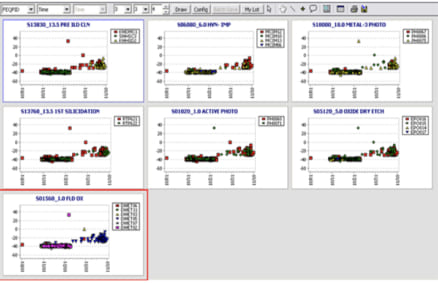
Analysis of significant differences in operational data (EQPID/PPID/Reticle/Probe Card/PartID/Foup) Correlation analysis of operational parameters (CD, THK, VT, BIN, etc.) value Result & Chart (Summary & raw data , Trend ,X,Y Chart,Bar Chart,Histogram,Box Plot,Pie Chart)
Search & Batch
Search : Line / term / Process / Partid
Data Area (FAB(P)/FAB(M)/DC(In-Line)/DC(Final) /EDS(BIN)/EDS(Measure)
Result & Chart
06
Analysis of significant differences in operational data (EQPID/PPID/Reticle/Probe Card/PartID/Foup) Correlation analysis of operational parameters (CD, THK, VT, BIN, etc.) value Result & Chart (Summary & raw data , Trend ,X,Y Chart,Bar Chart,Histogram,Box Plot,Pie Chart)
Search & Batch
Search : Line / term / Process / Partid
Data Area (FAB(P)/FAB(M)/DC(In-Line)/DC(Final) /EDS(BIN)/EDS(Measure)
Result & Chart
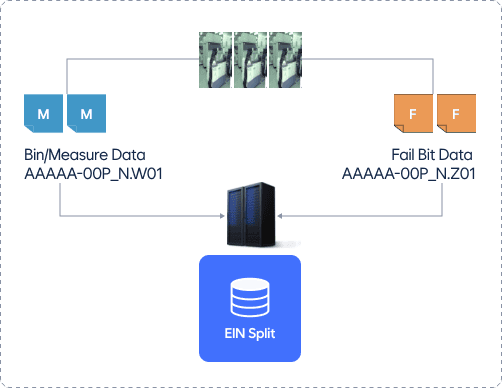
07
Defect & EDS chip level (BIN , Fail Bit) correlation analysis Defect Class Kill Ratio , Chart (Bar –Side / Bar-Stacked / H Bar–Side / H Bar-Stacked / Scatter / Line ), Map
Search & Batch
Result & Chart
08
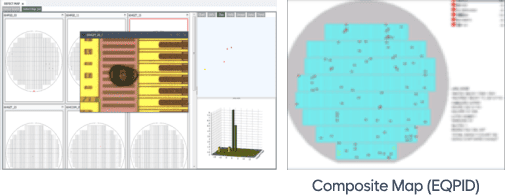
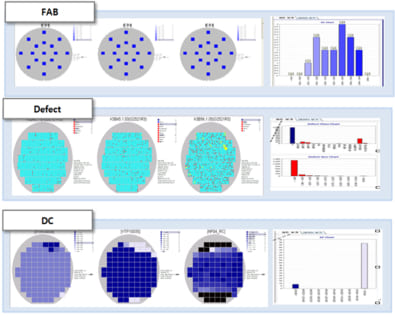
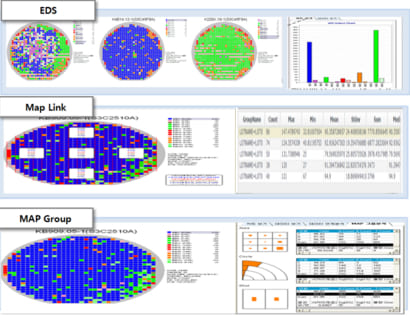
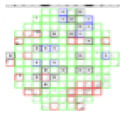
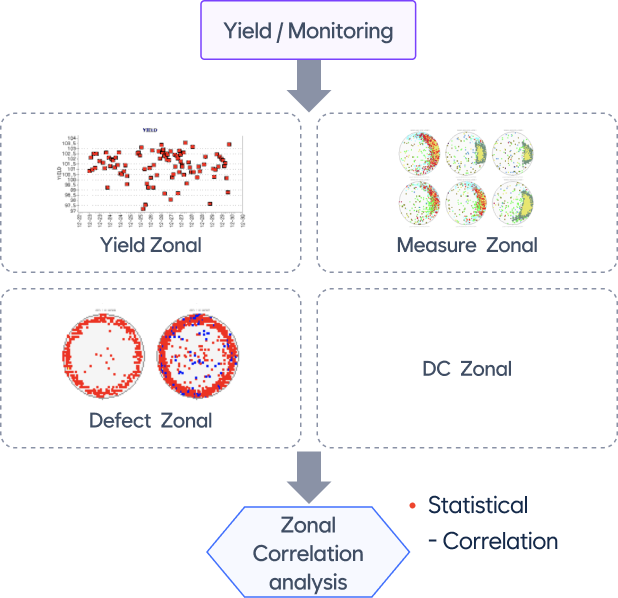
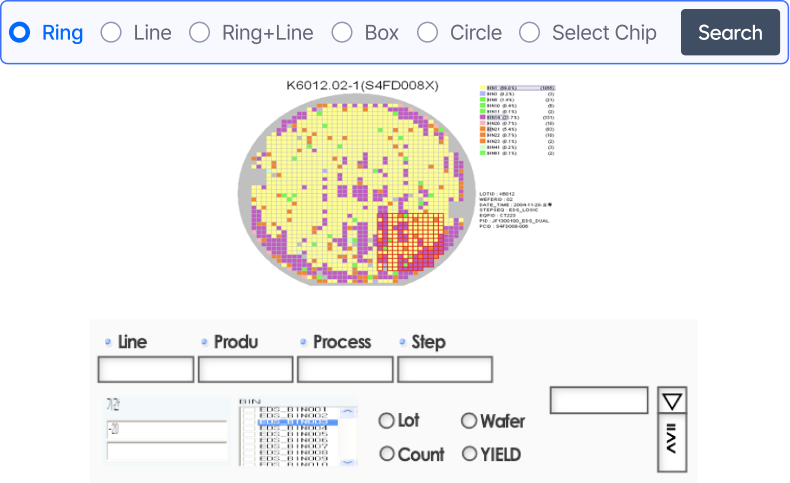
FAB / Defect / DC / EDS (bin) / EDS (Measure) Map & Chart
User Define Zone (Ring, Line, RingLine, Box, Circle, Select Chip) analysis EDS BIN,MSR (AVG, std, median, sum, Min , Max , FAB Defect Code Defect Density)
Zone Analysis
Map Search
LOT1
Wafer2
product
70%
2017-05-21
LOT2
Wafer1
product
70%
2017-05-21
MAP Link
Lot Group
Commonality
11
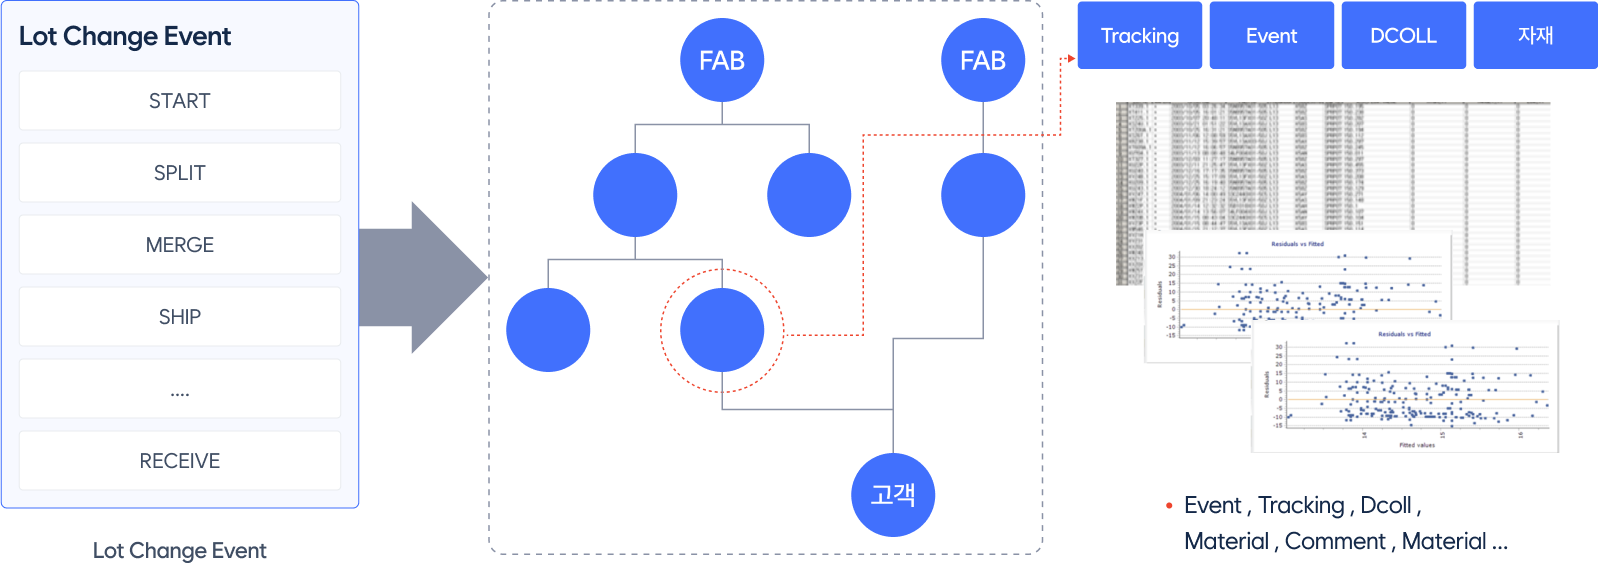
Bi-directional batch tracking and tracing Provides comprehensive information about batches (Events, tracking, FAB (measurements), DC, EDS, material, comments)
12
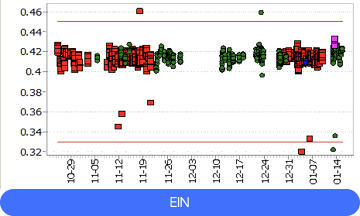
EIN (Engineer Inform Notification) Lot/Wafer Data I/F FAB / DC / EDS Evaluation Chart & Report, Mail
Select & Analysis
Result & Chart
PARTID
LOTID
STEP
Wafer ID
DESC
YIELD
S3PART
KOLT.1
150000
#12,1,3,4,6,7,8
NORMAL
91.2
#2,5,8, 11, 14, 17,20,23
EIN (CP01 CH_B, P-chuck)
90.2
LOTID
STEP
ITEMID
Normal
EIN
P. value
LSL
TARGET
USL
CntWF
AVG
STD
CntWF
AVG
STD
0853.1
6150000
CD1
2
2
0.2
2
2
0.2
0.1
1
2
3
LOTID
STEP
SPLIT Group
0_0
1_PC
2_BG
53_Malbalgub
K0853
2A0076R6
NORMAL
2
11
3
1
EIN (CP801 CH_B, P-chuck)
1
2
4
13
EQP commonality: Searches for common equipment within defective batch groups. Significant parameter differences: Searches for items (Fab, DC) between two groups (BAD Lot and GOOD Lot)
Search & Batch
EQP Commonality
EQP Progress
Time difference
EQP Path
Significant difference
FAB (measure)
DC
Result & Chart
14
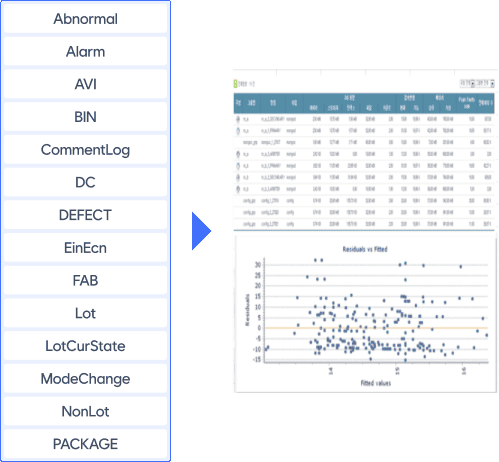
Search Engine: Enables flexible data access for environmental exploration and unstructured searches. Data Type : FAB (M), FAB(P), EDS Bin , DC , NonLOT, Comment , Material …
Search
Chart & Output
Product Support
“Verified or Sustainable”
More than 30 years of experience and over 100 factories
UMS
Providing comprehensive software maintenance through the UMS Center, addressing defect fixes, performance enhancements, feature improvements, and product updates after deployment
Operational Training
System administrator manual provided for smooth post-deployment operations
Product training for administrators
Dedicated Product Management Center to oversee operating systems and handle routine maintenance
Product Support
Product updates
Online manuals and user guides
Online platform for sharing feedback and suggestions related to the product